FISHBONE DIAGRAM ANALYSIS ON THE QUALITY OF LIGHTWEIGHT BRICKS PT. LOMBOK MULIA JAYA
Keywords:
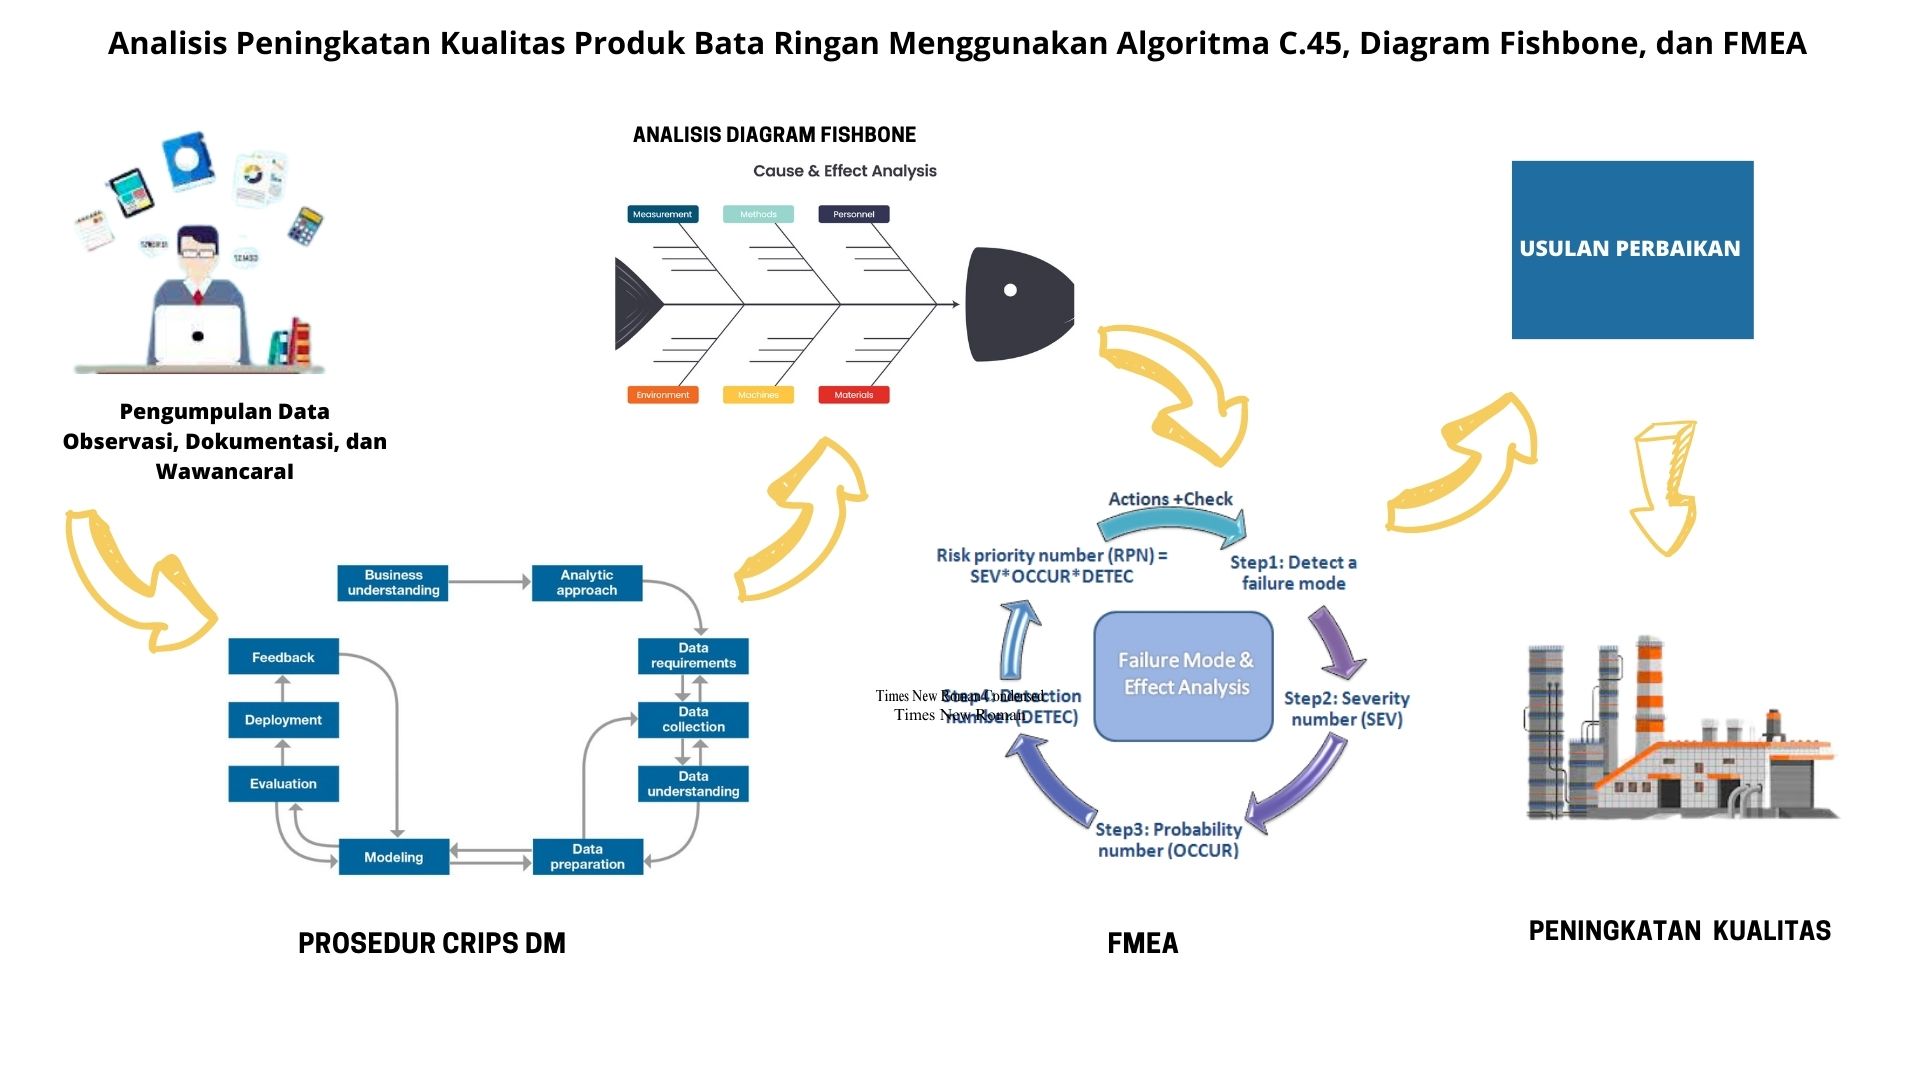
Diagram Fishbone, kualitas produkAbstract
This This research aims to analyze the quality of lightweight bricks at PT. Lombok Mulia Jaya using the Fishbone Diagram. The Fishbone Diagram is used as a tool to identify and analyze the causes of defects that occur in the products. The research involves direct observations at the production site and interviews with the Head of QC and Production to identify defects, such as "Gompal" (uneven surface), cracks, and lack of precision. Subsequently, the data from the interviews and observations are used to construct the Fishbone Diagram based on the 5M + 1E (Man, Machine, Method, Material, Measurement, and Environment) to analyze the causes of these defects. The outcomes of this analysis are expected to assist PT. Lombok Mulia Jaya in identifying and understanding the root causes that contribute to the "Gompal," cracks, and lack of precision in their lightweight bricks production. With a comprehensive understanding of the defect causes, appropriate corrective measures can be taken to improve the overall quality of the products and production process. This research is anticipated to make a positive contribution to the company's efforts in enhancing product quality and customer satisfaction